Embedded Systems: ARM ETM Trace Module1
Embedded Systems: ARM ETM Trace Module
Overview
ETM (Embedded Trace Macro-Cell) allows collecting instructions and data trace information in real-time from the processor.
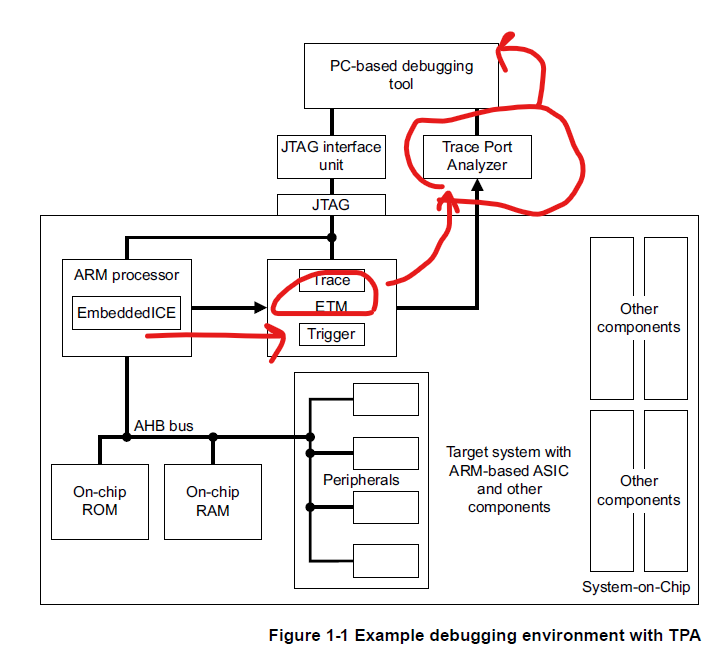
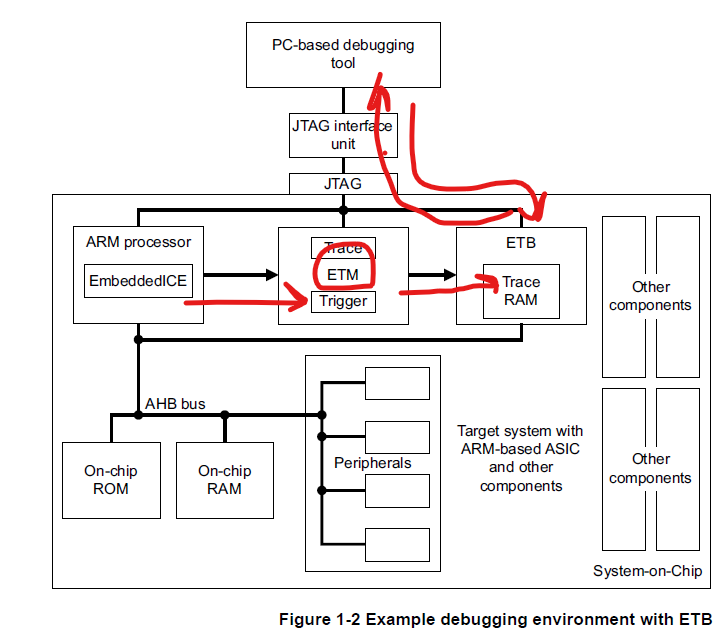
These trace information are supplied from the processor to the ETM module. The ETM module can either output these details in compressed format via an external interface (TPA - Trace Port Analyzer, also referred to as the ETM Interface connector), or it can buffer them into internal dedicated memory, like ETB (Embedded Trace Buffer), to be read out later via slower interfaces like JTAG or SWD debug interfaces.
---
Trace Features
ETM supports more than just tracing instructions and data; it also offers some control features like Triggering and Filtering.
- Triggering:
Triggering allows defining a certain address range where ETM will only start tracing if the instruction address is within that defined range. This reduces the amount of information to be transmitted over the external interface (TPA) or stored in local memory (ETB). This feature helps to manage limited bandwidth for external interfaces or systems with limited memory for storing trace packets.
- Filtering:
ETM filtering is based on comparator address matching. If an instruction address or a data address falls into the pre-defined address range, a filter can be applied to allow or prevent that address from being traced and broadcasted by the ETM module. Filtering can be based on:
- Processor execution mode
- VMID (Virtual Machine ID) — applicable only for processors with virtualization support (not for Cortex-M processors)
- Context ID — also not applicable for Cortex-M processors.
ETM Support
ETM is optional. For instance, a Cortex-M4 or Cortex-M3-based platform may support ETM, while another product using the same processor might not. Always check the product specification to confirm whether the ETM module is supported.
If ETM is supported, ensure that a hardware debugger module with ETM interface support is used. As discussed in some previous writings, there are two modes of tracing:
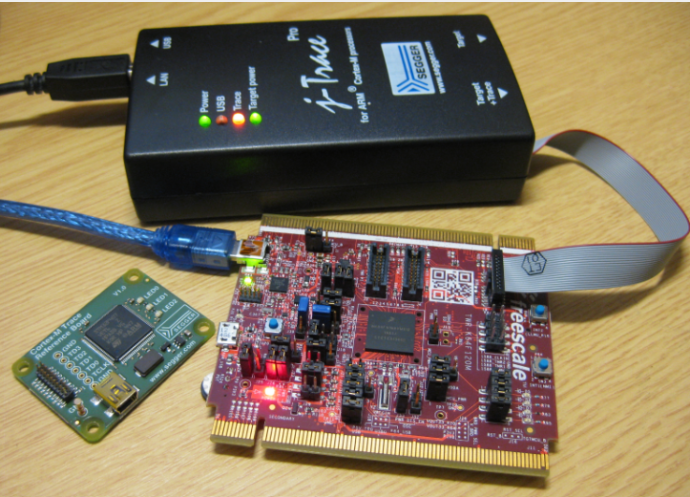
- Off-chip tracing: Requires using the ETM external connector, also known as TPA (Trace Port Analyzer), used by the TCD (Trace Capture Device) to collect trace packets, decompress them, and then combine them with the program image symbols to create readable coverage reports.
- On-chip tracing: Involves using internal features of the processor.
Hardware Debugger Modules with ETM Interface Support
Examples of famous hardware debuggers with trace support:
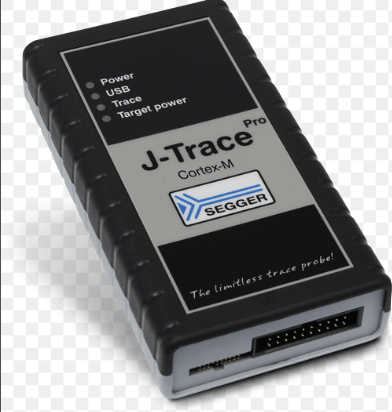
- Segger J-Trace from Segger
- UlinkPro from ARM Keil
- Lauterbach (Microtrace) from Lauterbach
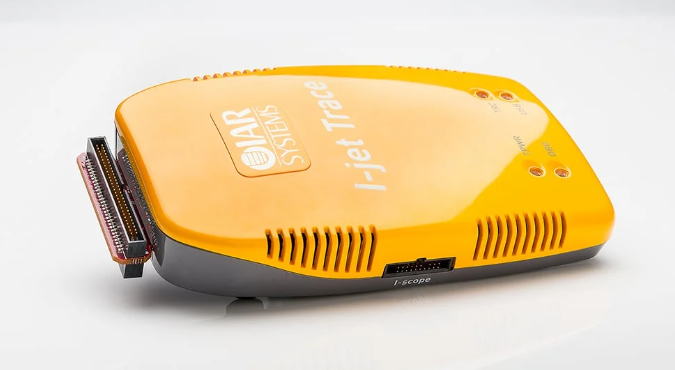
- I-Jet from IAR
 Embedded Systems: ARM ETM Trace Module